
Everything you need to get started
FieldTalk basic package
The basic package in FieldTalk includes data collection, presentation widgets for trends and graphs, dashboard presentation, and tools for analysis.
FieldTalk Analytics
The cloud service that enables your business to better utilize existing data. Many businesses today have valuable data without knowing how to utilize it to increase revenues and cut costs. With FieldTalk Analytics, many will have a much clearer picture of how this can be done.
Here are examples of the data FieldNet collects today:
- SCADA, PLS, PLC...
- Control systems (OPC) from Siemens and ABB
- Energy data from grid operator/power supplier
- Waste data from your waste management company
- Data from ERP systems, Optivision, Cognos, and several maintenance systems
- Sensor data:
- Kampstrup, Aidon (Power, Heat, Water meters...)
- LNG/LPG
- M-bus and Modbus data, including Elvaco.
- NIR meters - Analyzing the medium in pipes.
FieldTalk Analytics integrates well with many other systems in your business and makes it easy to see the relationship between data from different systems. We believe that this is essential to have a good decision-making foundation for important decisions and future strategy.
FieldTalk Analytics provides you with:
- Full overview in just 1 click and 1 minute!
- Interactive dashboards
- Customized content for any role or group in your business.
-
- Each part of the analysis dashboard can be built up by yourself, shared with others, or create common presentations that can be used internally or externally.
- Dashboards can be set up to report in real-time, i.e. periodically update data in the view.
- Several dashboards can be inserted into a "carousel" display, which is suitable for large screens, e.g. in meeting rooms, receptions, and similar.
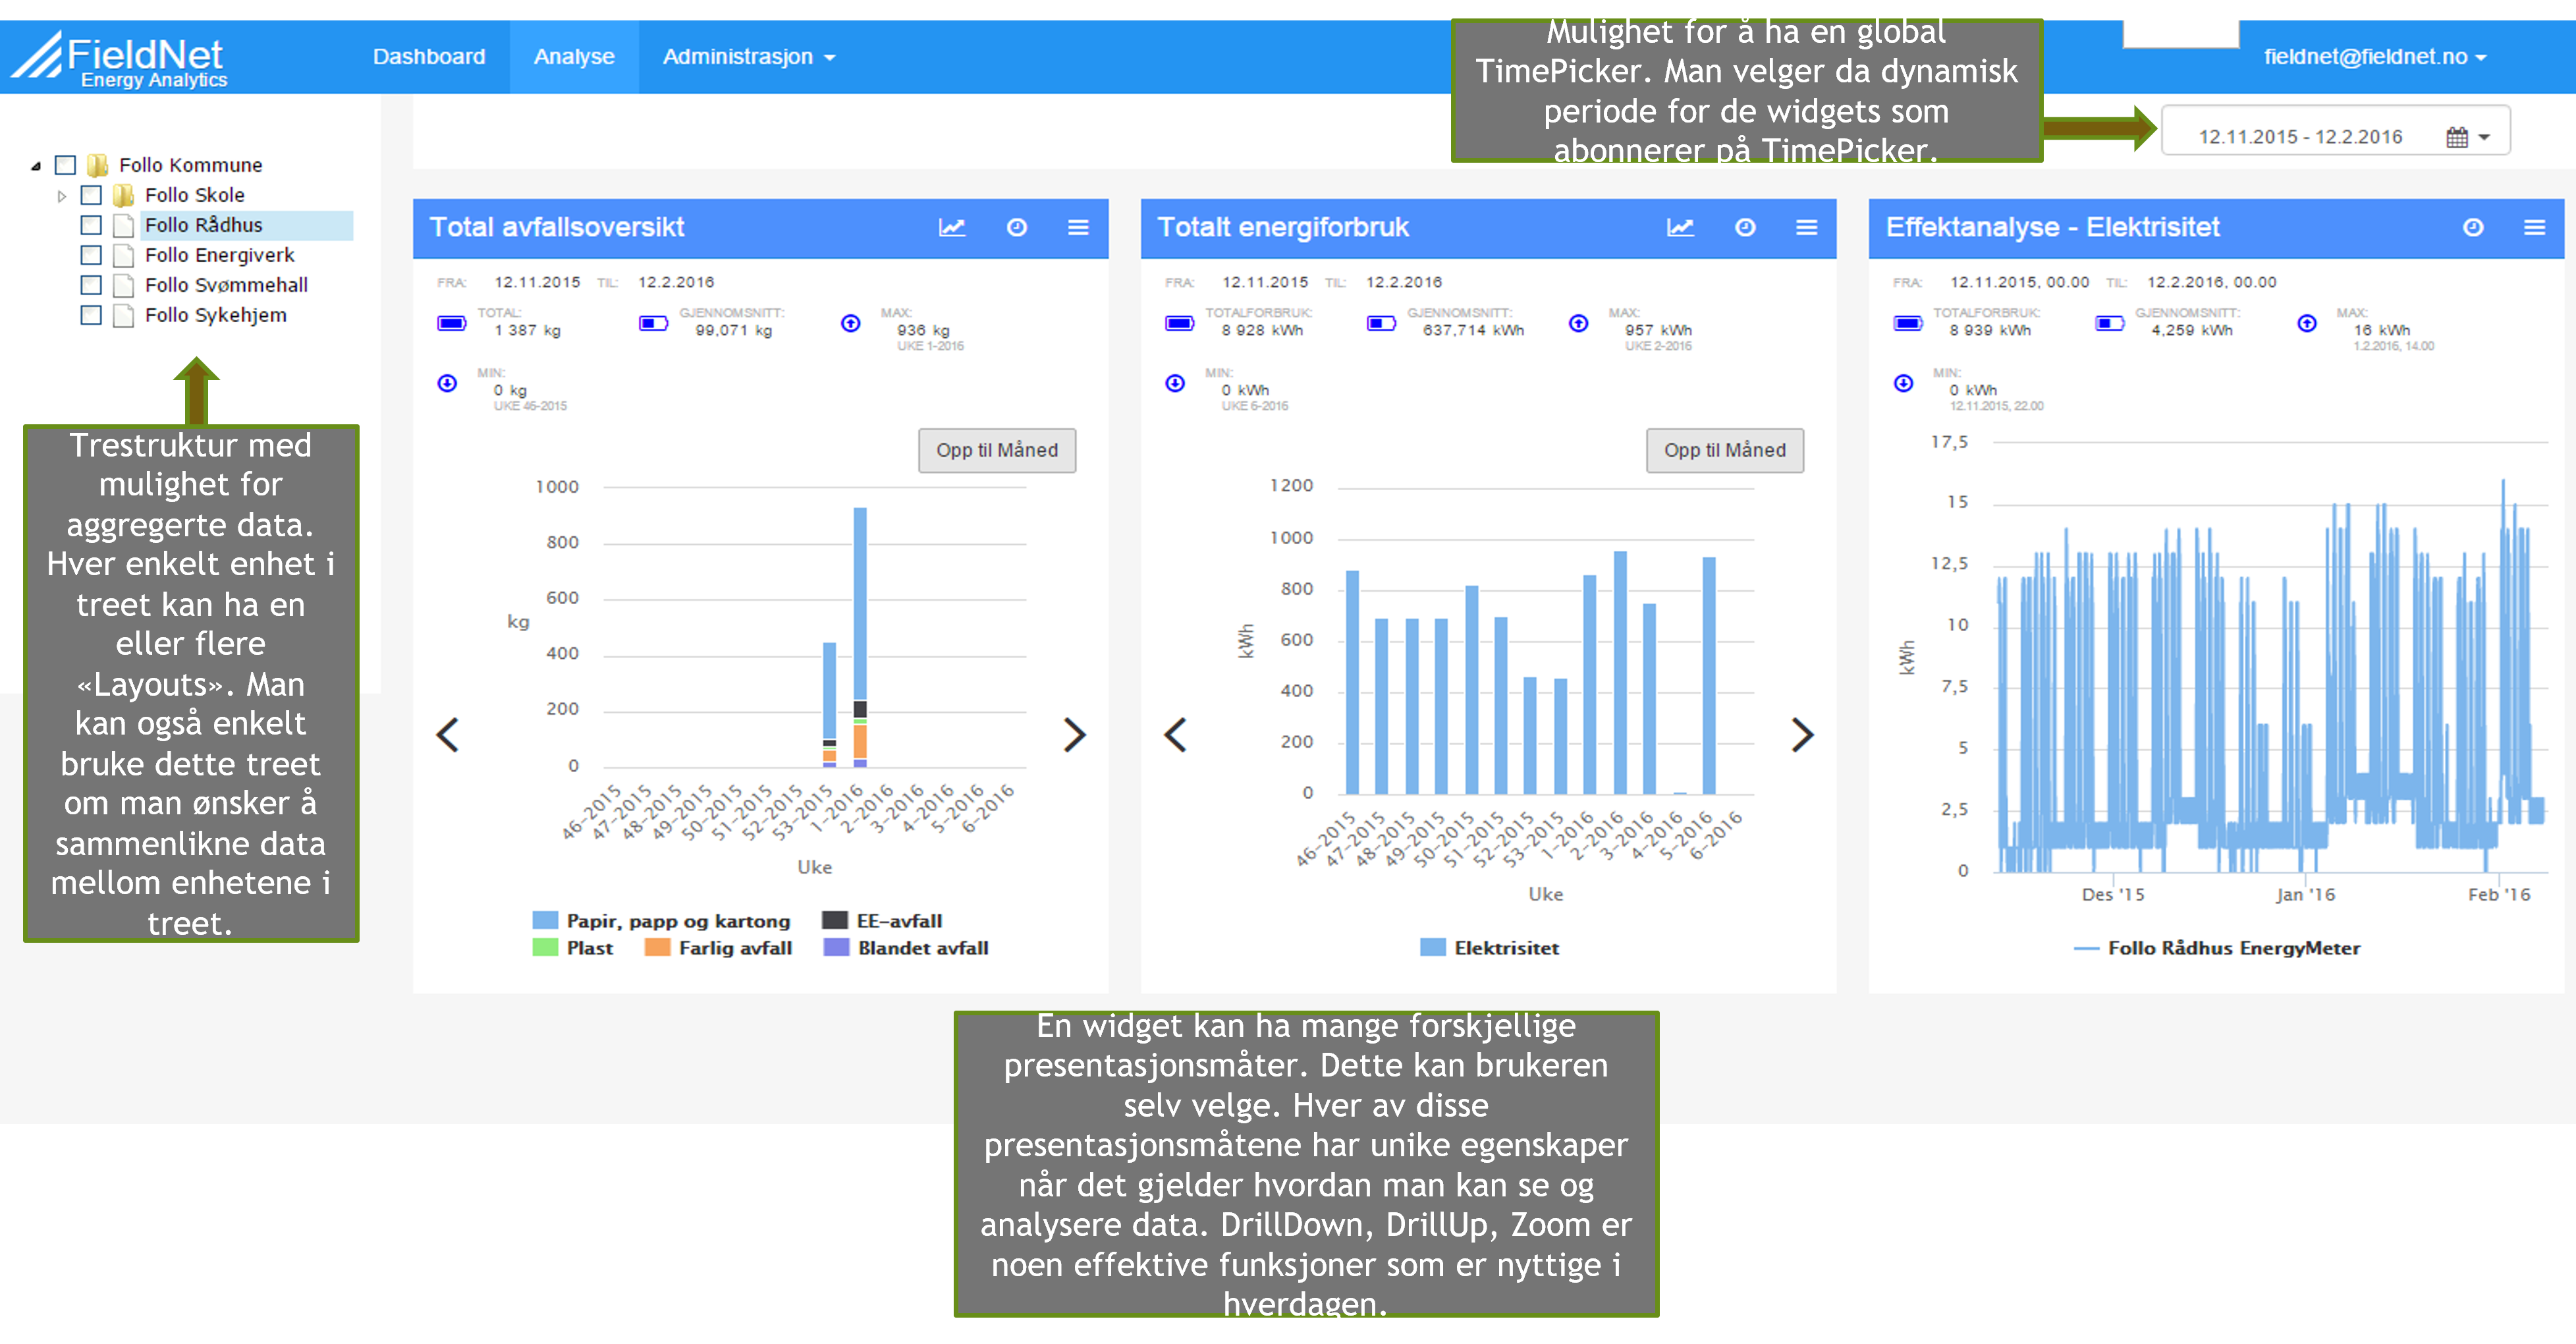
The following examples show possibilities for analysis and visualization in FieldTalk Analytics:
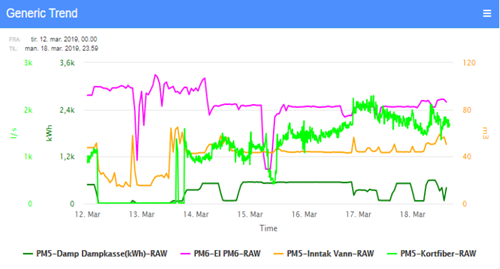
General trend widget that displays one or more measurement signals together in the same diagram. Measurement data may have different units (see example). Selection of each measurement signal can be based on raw value (RAW), processed value (such as AVG, IAVG, SAVG, MID, MIN, MAX, STEP, COUNT, SUM). Processing is done on the server, i.e., only the results are transferred to the web client. This allows the user to reduce data transfer, which in turn provides good response time.
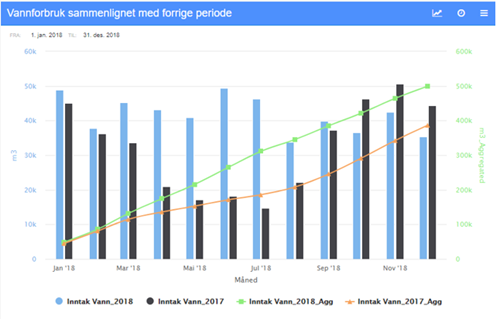
Widget Compare
Compares a measurement signal in a time period to the same measurement in the previous period.
(For example, water consumption in 2018 compared to 2017)
This is shown per sub-period and as an aggregated value for the entire period. The meter is set up manually.


