
Efficiency - Regularity - Batch Analysis - Technical Condition
Production analysis
In all production processes, there are opportunities for improvement. This can include more efficient use of raw materials, reduced energy consumption, better work processes, improved regularity, and product quality.
FieldTalk provides the opportunity to collect all production data, connect them to your analysis models, and bring forth data for improvements and changes in production. All in real-time, while you can take action and correct.
FieldTalk enables you to see productivity across the entire factory, compare over time, and build models that allow you to see the entire factory simultaneously.
FieldTalk uses standards and methods for collecting and analyzing production data, such as OEE (Overall Equipment Efficiency). The OEE model provides a simple, standardized method for viewing production, availability, stoppages, and failure situations.
FieldTalk also supports models for tracking, batch analysis, and reporting. This enables you to connect production to production planning, work orders, and resource and time usage at the product level.
Process and production analysis
Analysis of production data, whether it is continuous or batch production, requires customization to obtain the best possible analysis basis. FieldTalk has such a large capacity that you don't have to choose which measurement data to exclude, but can take "everything," all measurement data with high resolution.
In the next step, you can connect the measurement points to standardized models.
Later, you can optimize your model, replace measurement points with others, and rerun the analysis to obtain a more accurate result.
Production statistics
Displays graphical run statistics for a machine or production line.
- Provides historical and real-time presentation for each production line
- When staffing plan is included, OEE model can be used to obtain comparable data with other lines.
- Both for graphical and text reporting
- Combined with product data and other machine measurement data, profitability, resource usage and maintenance needs can be analyzed.
(The graph shows the status of the machine based on PackML OMAC/ISA standards.)
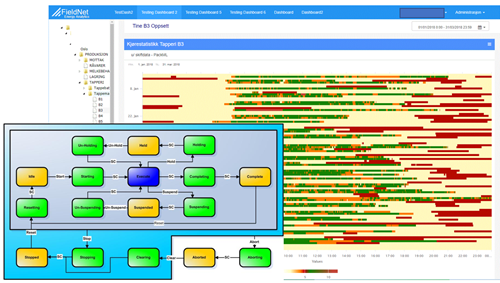
OEE raw data - PackML
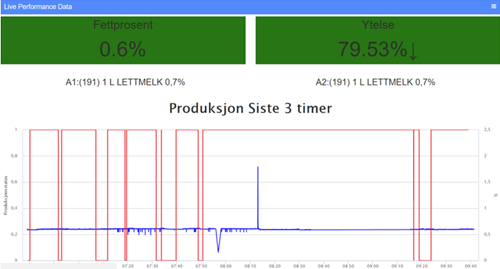
Sanntids dashboard
Real-time dashboard
Displays production data for a machine/line in real-time. Monitors machine status and calculates performance. Retrieves product quality data (in the example, NIR sensors are used).
Here, stoppage data can be extracted and, with the connection to other measurement data, stoppage causes and deviations can be traced.
BatchTracker
Tracking and monitoring production in batches provides new and improved opportunities for real-time analysis of production.
- Analyzing production at the product and order levels.
- Examining specific resource usage per batch per product
- Combining OEE analysis data to provide insights into efficient use of production capacity by product type.
- Documentation of energy usage per unit.
- Linking to the quality system and lab data.
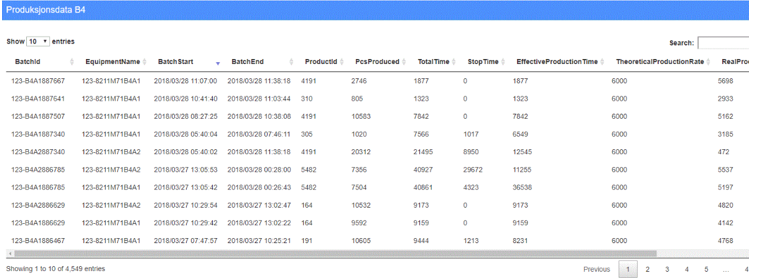
BatchTracker


